Z-score Distribution Table

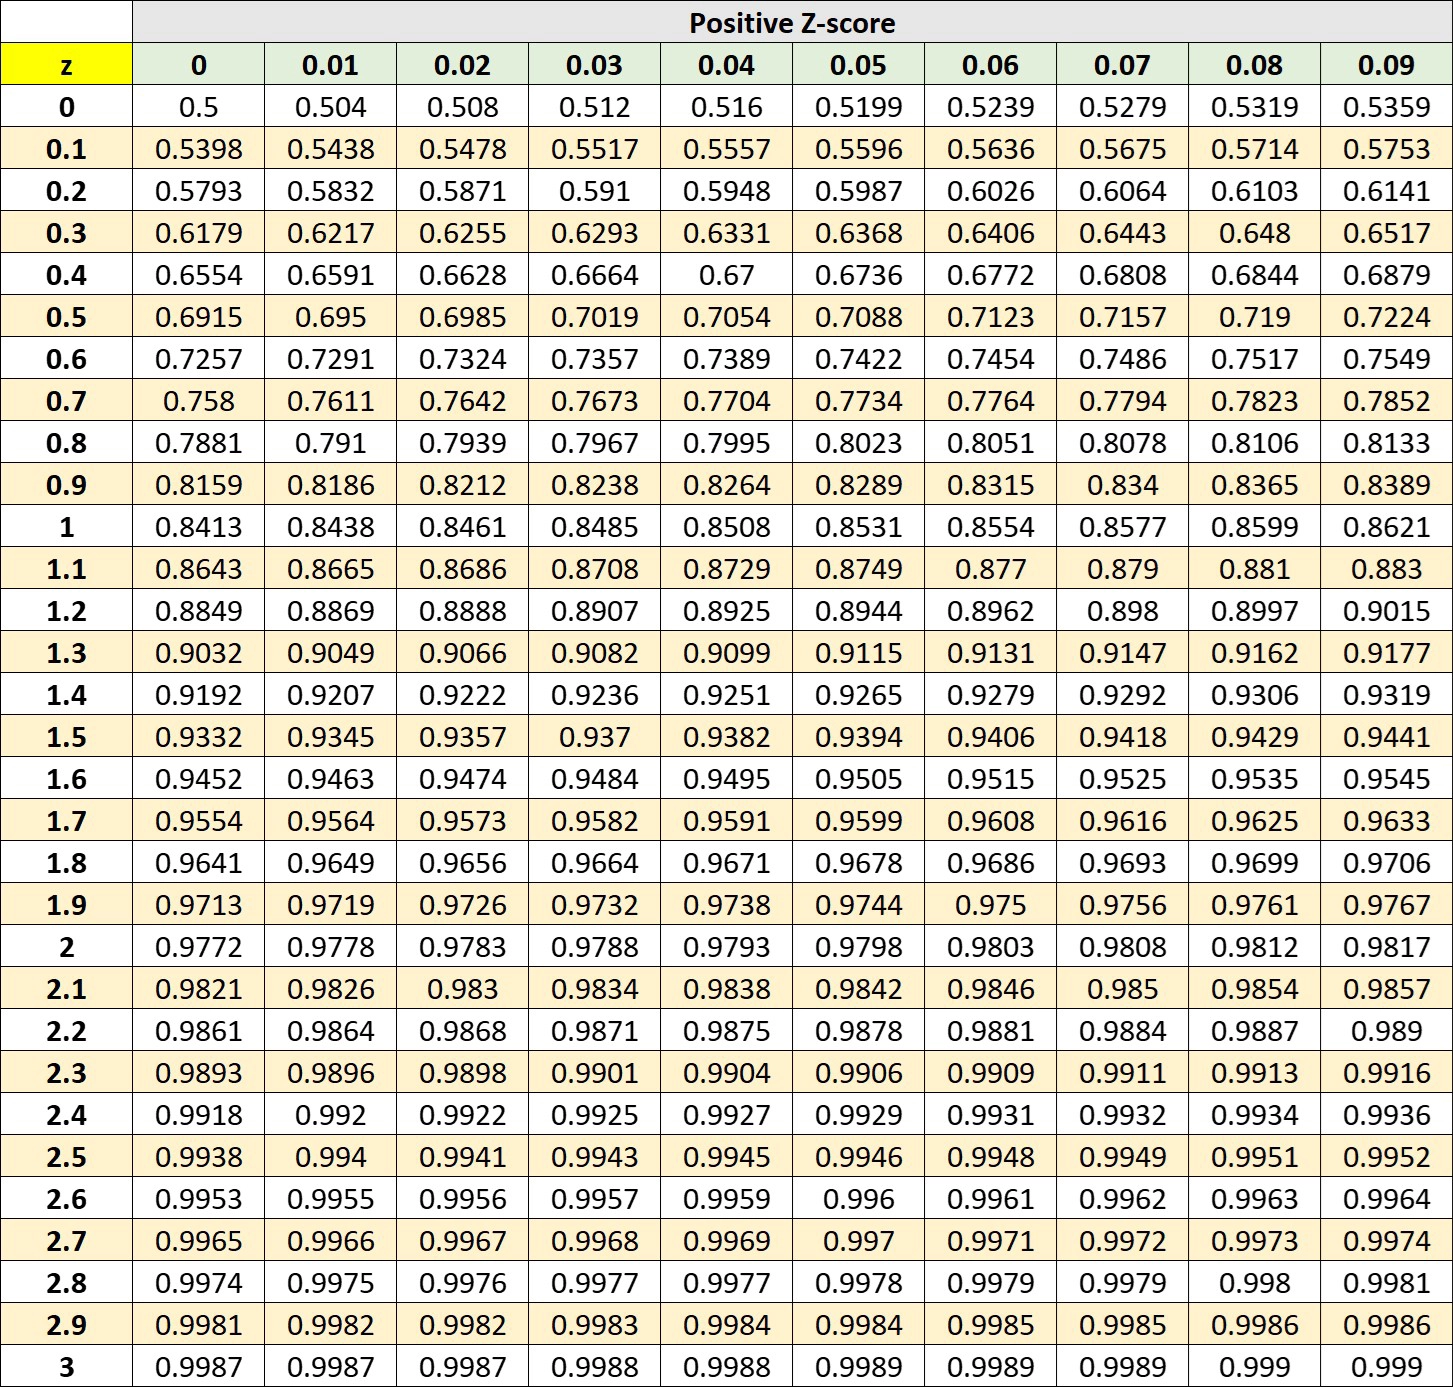
The following Z-score Distribution Table shows the area under the standard normal curve on different probability levels (P) and Z-score (z).
For two-tailed test, multiply the value by 2.
Positive Z-score value:
For negative Z-score:
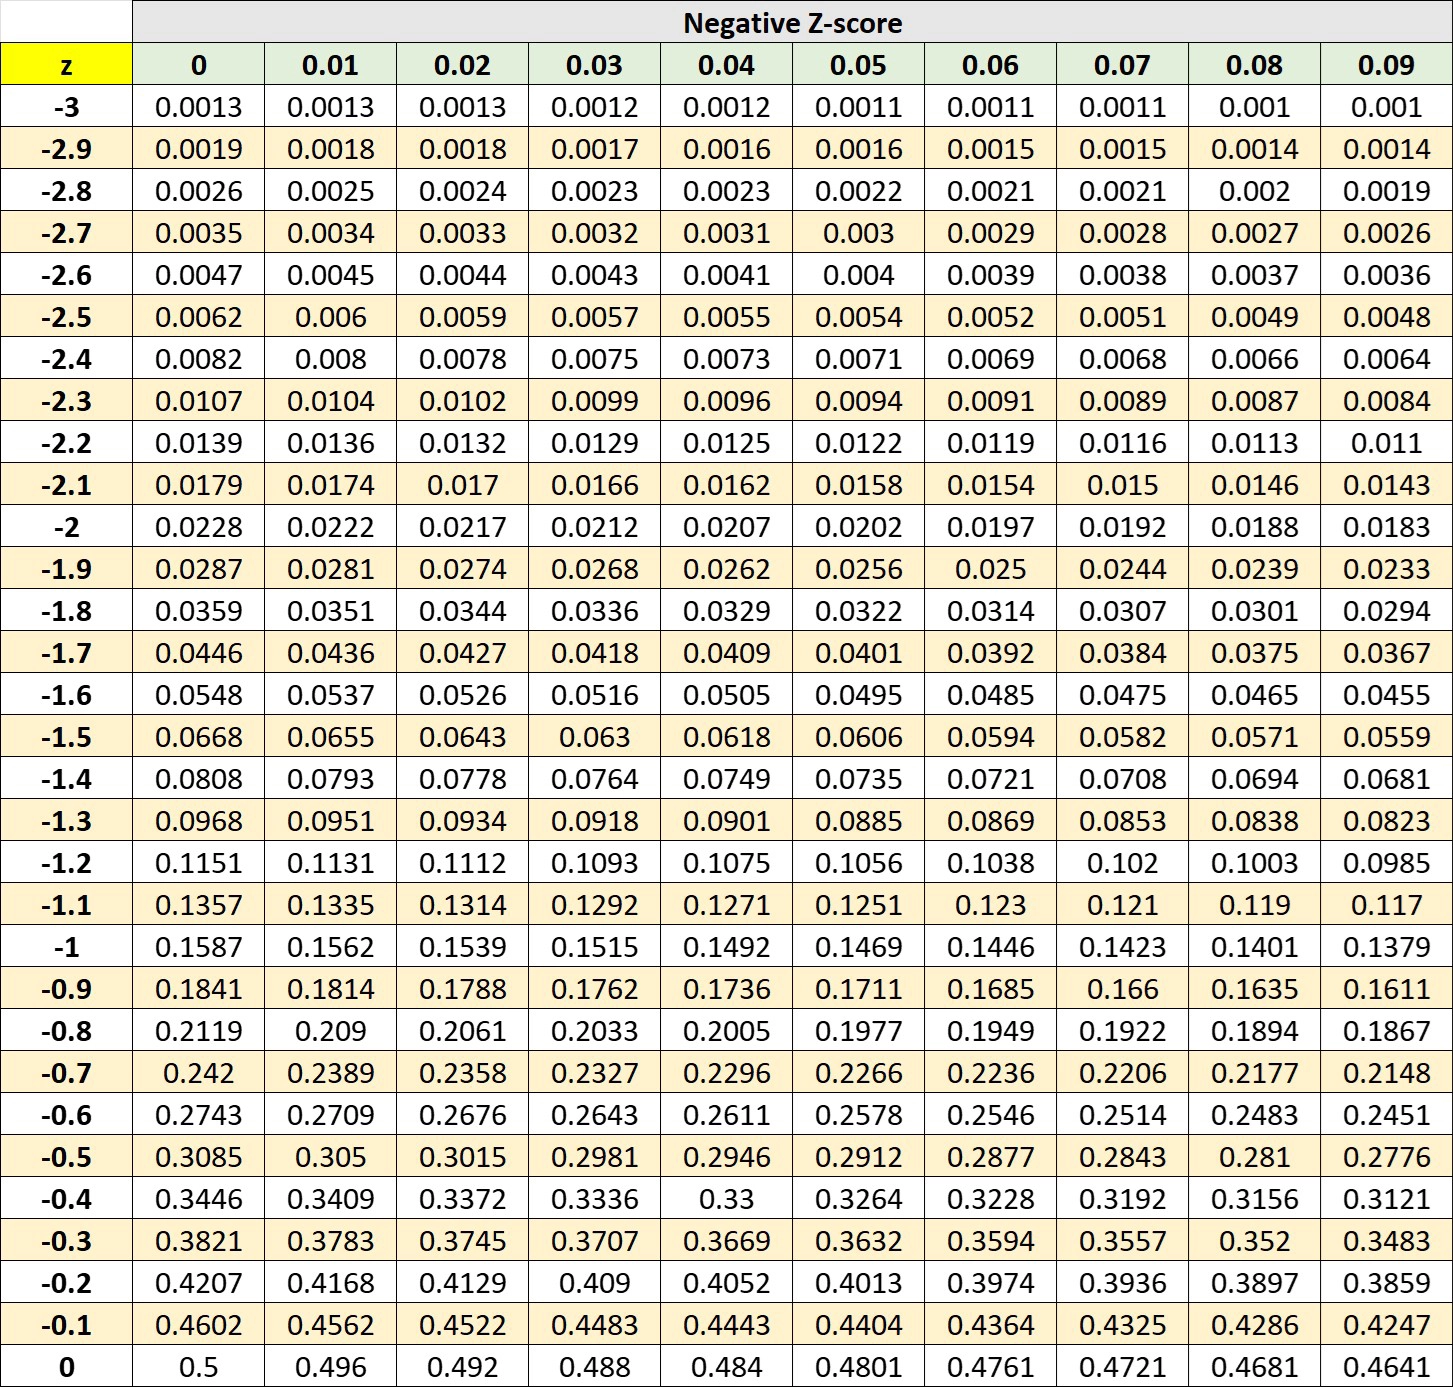
Refer to this table anytime you want to look for values on the left or right of the mean in a normal distribution test.