How to calculate the P-value from the T-Distribution Table

To calculate the P-value from the T-test, you need to find the value that corresponds to the T value from the T-Distribution Table.
This tutorial will show some examples of how to use the T-table.
Example: Find P-Value for a Two-tailed T-Test
Suppose you run a Two-tailed test that has a T value of 1.82, the Degrees of Freedom is 19 and the alpha level is 0.5.
Looking up at the T-Distribution Table, you get that the value closest to 1.82 with DF of 19 are 1.729 and 2.093:
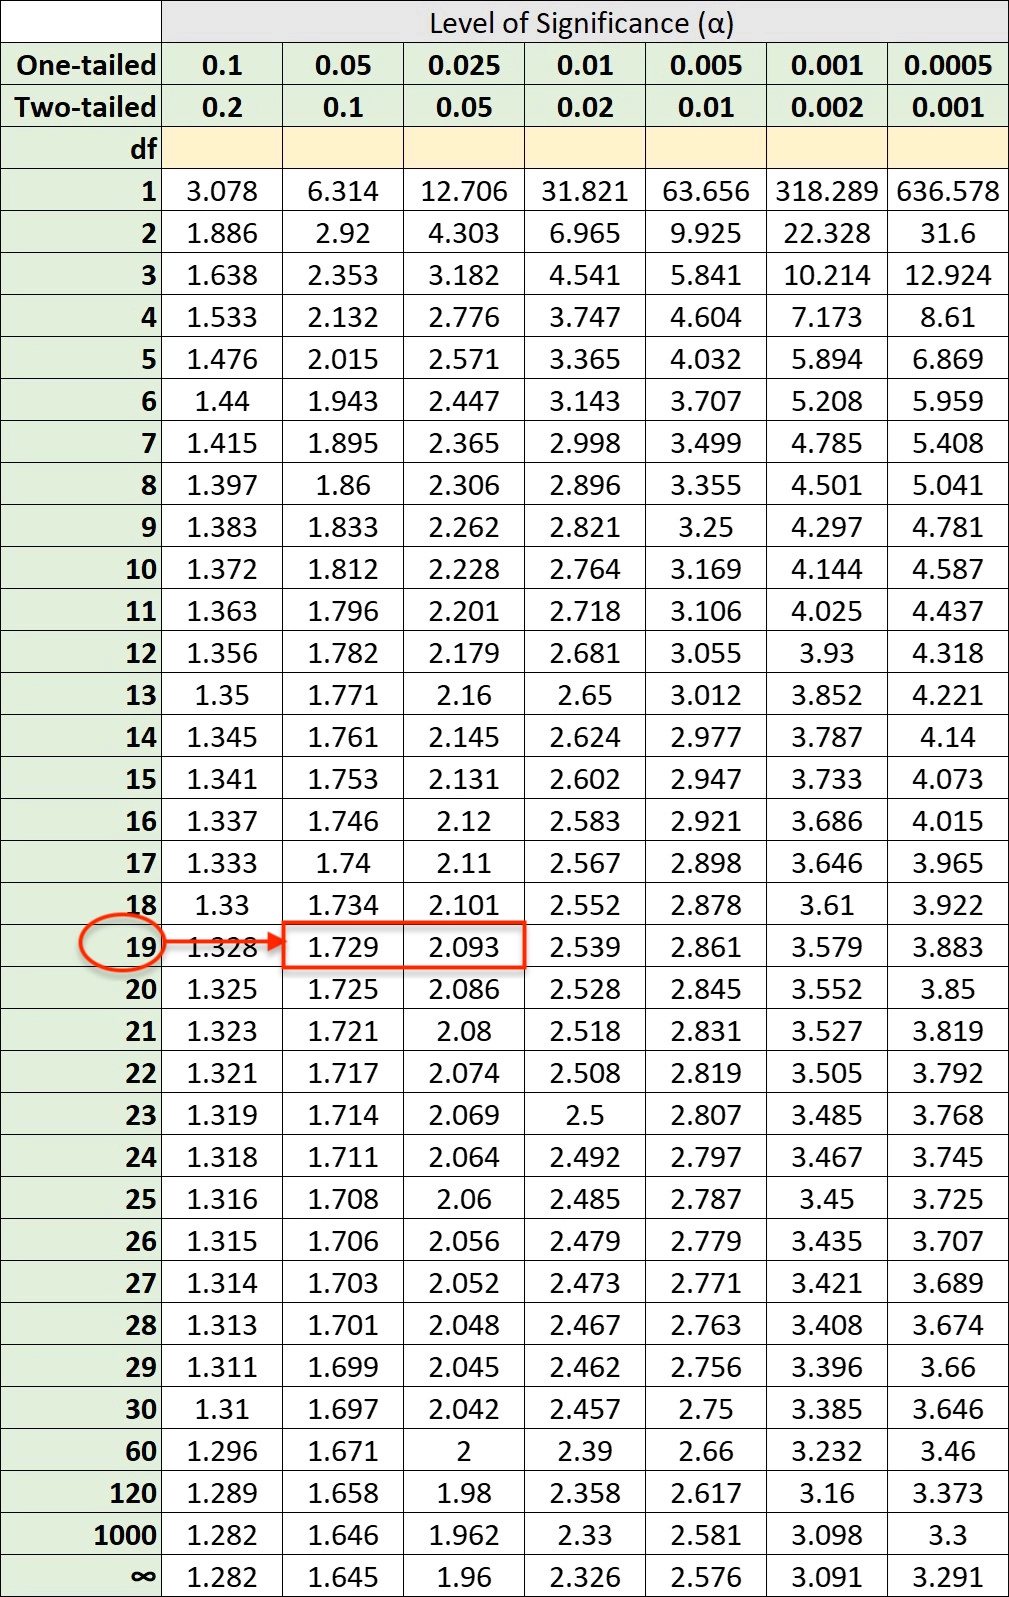
Next, look at the top of the table to find the alpha level of these values:
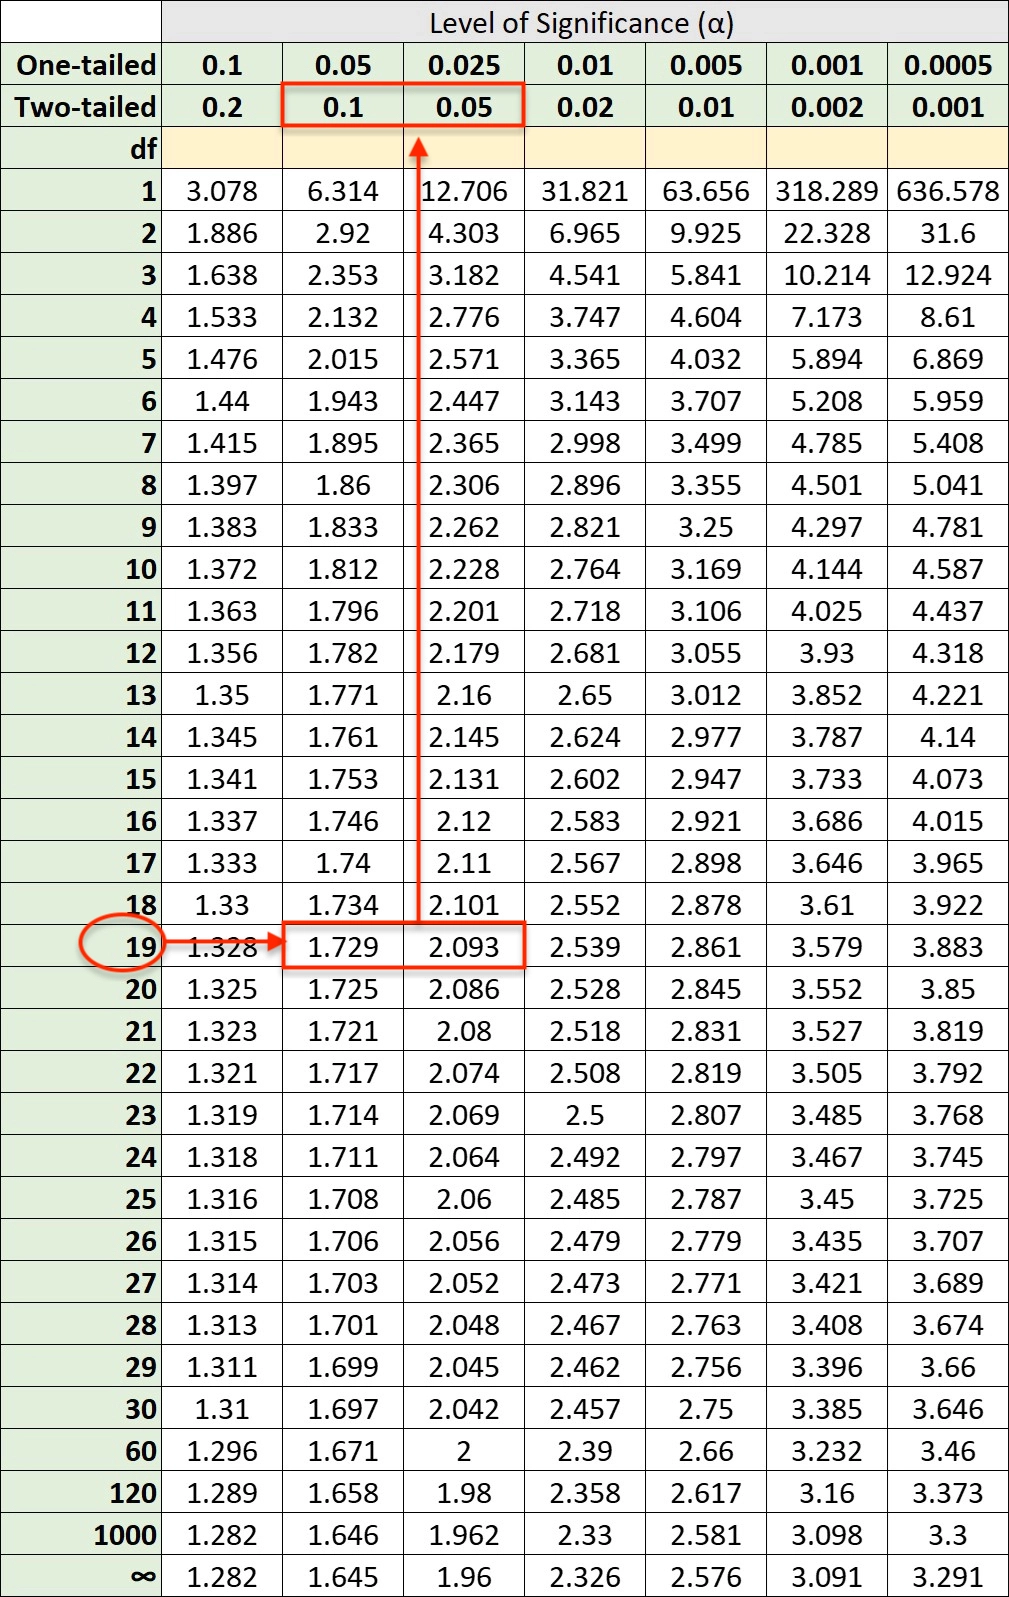
The alpha level is somewhere between 0.1 and 0.05. because the value is closer to 1.729, we can estimate the P-value is around 0.08.
Because the P-value 0.08 is greater than the chosen alpha level of 0.05, we can conclude that the null hypothesis is supported by the test.
The steps are similar when you’re running a one-tailed test. You just need to look at the One-Tailed test row instead.
Using the t to P-value calculator
Please note that calculating the P-value using a T-Distribution Table is less accurate.
If you want to find the exact value of P, you need to use a statistical software or a t to P-value calculator here.
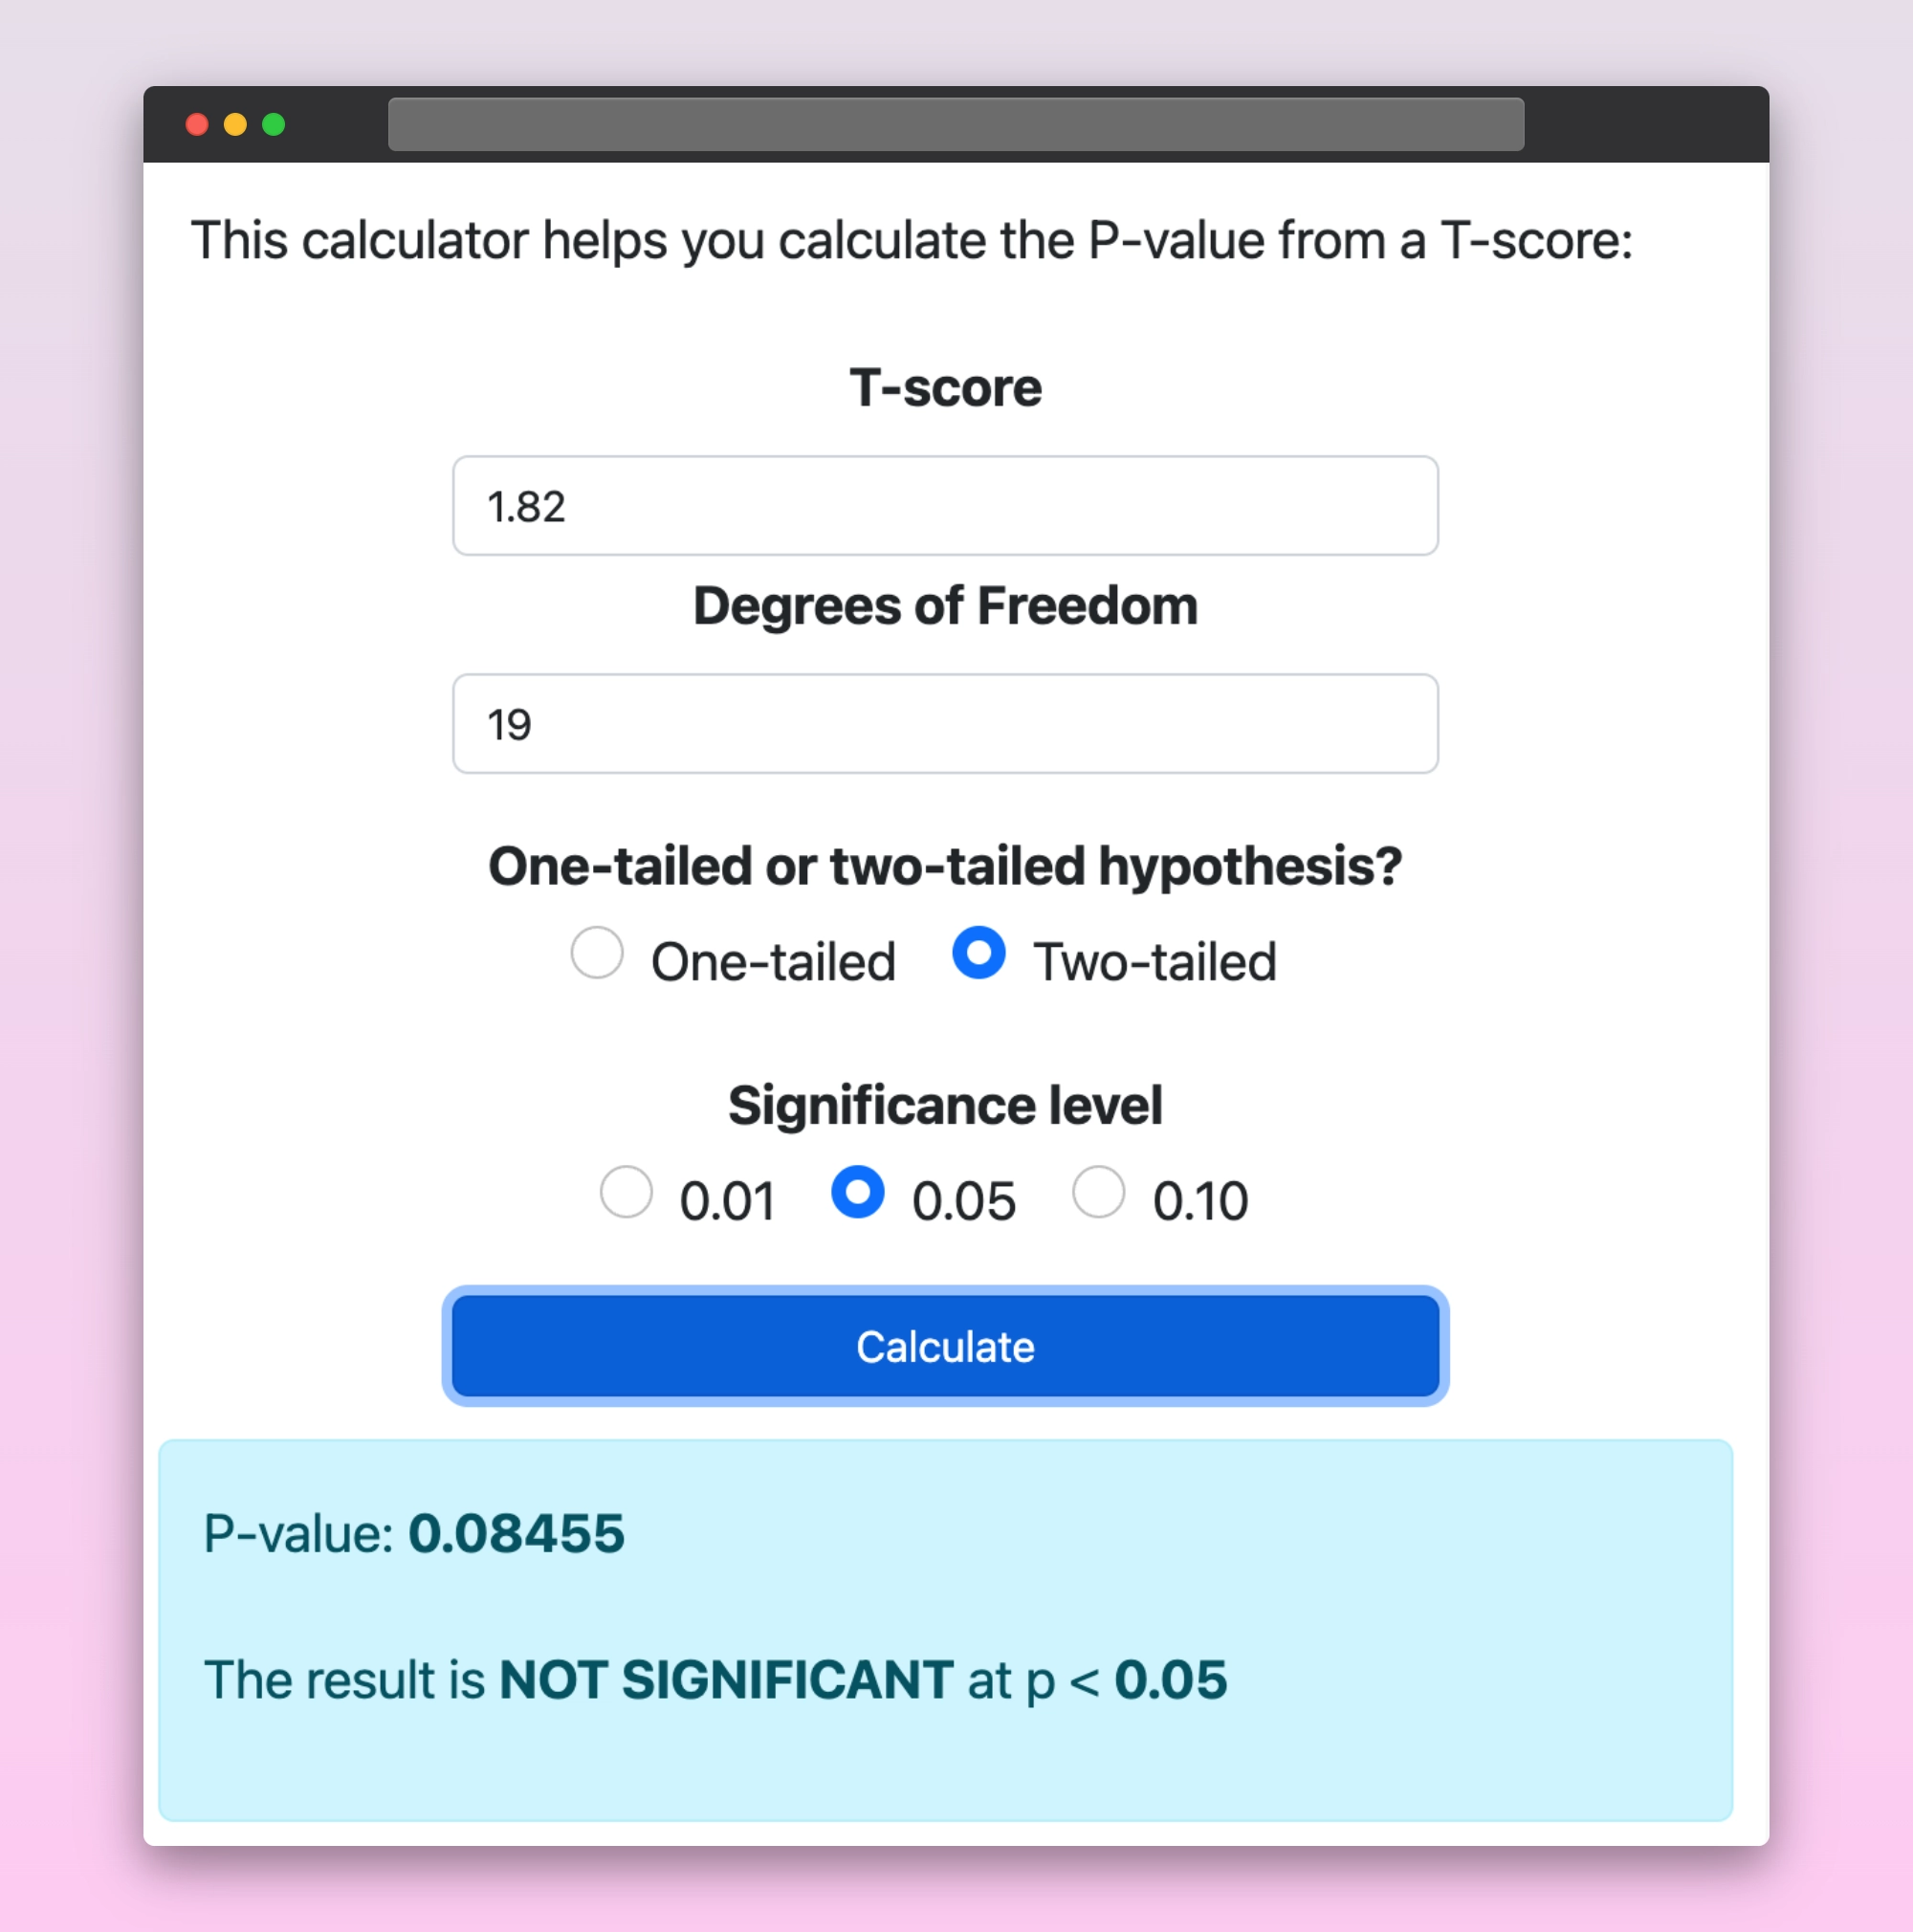
Here, you can see that the exact P-value is 0.08455 and it’s not significant enough to reject the null hypothesis. The P-value needs to be lower than 0.05 to reject the null hypothesis.
The calculator will need the T value, the type of the test, and the significance level to calculate the P-value for you.
I hope this tutorial helps. See you in other tutorials!